Crowds were up at all four Walt Disney World parks today. Posted wait times were the second-highest they’ve been at Animal Kingdom over the past month. Waits at Magic Kingdom, EPCOT, and Hollywood Studios were also in the top 8 of the past 30 days, too. We received 176 actual wait times today. Let’s do the numbers!
Animal Kingdom
Let’s start in Pandora. Flight of Passage had the highest average posted waits in the park today at 81 minutes. Its 7-day average is 52 minutes, so today ranks #1 for this week. Its 30-day average is 58 minutes, so today ranks #2 for the past month. We received 6 actual wait times today, and the actual wait averaged 79% of the posted wait time.
Na’vi River Journey had an average wait time today of 68 minutes. Its 7-day average is 48 minutes, so today ranks #1 for this week. Its 30-day average is 47 minutes, so today ranks #1 for the past month. We received 4 actual wait times today, and the actual wait averaged 76% of the posted wait time.

If you’re planning on visiting Walt Disney World this holiday season, you’ll need a special tool at your side. Subscribe today and get our Lines app too.

DINOSAUR had an average wait time today of 52 minutes. Its 7-day average is 31 minutes, so today ranks #1 for this week. Its 30-day average is 31 minutes, so today ranks #1 for the past month. Its 365-day average is 33 minutes, so today ranks #46 for the past year. We received 7 actual wait times today, and the actual wait averaged 99% of the posted wait time.
Expedition Everest had an average wait time today of 46 minutes. Its 7-day average is 32 minutes, so today ranks #1 for this week. Its 30-day average is 31 minutes, so today ranks #2 for the past month. We received 13 actual wait times today, and the actual wait averaged 42% of the posted wait time.
Kali River Rapids had an average wait time today of 41 minutes. Its 7-day average is 14 minutes, so today ranks #1 for this week. Its 30-day average is 20 minutes, so today ranks #1 for the past month. We received 4 actual wait times today, and the actual wait averaged 97% of the posted wait time.
Kilimanjaro Safaris had an average wait time today of 38 minutes. Its 7-day average is 25 minutes, so today ranks #2 for this week. Its 30-day average is 22 minutes, so today ranks #2 for the past month. We received 9 actual wait times today, and the actual wait averaged 54% of the posted wait time.
Hollywood Studios
As usual Runaway Railway had the highest posted wait time average in the park – 81 minutes. Its 7-day average is 81 minutes, so today ranks #3 for this week. Its 30-day average is 80 minutes, so today ranks #12 for the past month.
Toy Story Mania! had an average wait time today of 30 minutes. Its 7-day average is 28 minutes, so today ranks #3 for this week. Its 30-day average is 29 minutes, so today ranks #13 for the past month. We received 9 actual wait times today, and the actual wait averaged 34% of the posted wait time – that’s low.
Slinky Dog Dash had an average wait time today of 65 minutes. Its 7-day average is 69 minutes, so today ranks #4 for this week. Its 30-day average is 66 minutes, so today ranks #18 for the past month.
Alien Swirling Saucers had an average wait time today of 26 minutes. Its 7-day average is 26 minutes, so today ranks #2 for this week. Its 30-day average is 25 minutes, so today ranks #10 for the past month. We received 4 actual wait times today, and the actual wait averaged 61% of the posted wait time.
Rock ‘n’ Roller Coaster had an average wait time today of 58 minutes. Its 7-day average is 52 minutes, so today ranks #1 for this week. Its 30-day average is 51 minutes, so today ranks #1 for the past month.
Star Tours: The Adventures Continue had an average wait time today of 29 minutes. Its 7-day average is 25 minutes, so today ranks #1 for this week. Its 30-day average is 27 minutes, so today ranks #9 for the past month.
The Tower of Terror had an average wait time today of 47 minutes. Its 7-day average is 54 minutes, so today ranks #5 for this week. Its 30-day average is 50 minutes, so today ranks #18 for the past month. We received 4 actual wait times today, and the actual wait averaged 74% of the posted wait time.

Millennium Falcon: Smugglers Run had an average wait time today of 56 minutes. Its 7-day average is 53 minutes, so today ranks #3 for this week. Its 30-day average is 56 minutes, so today ranks #17 for the past month. We received 6 actual wait times today, and the actual wait averaged 106% of the posted wait time.
Rise of the Resistance is having a really good day of operations, with only a handful of minor delays in calling boarding groups. The park opened an hour early, so the attraction is already above boarding group 110.

Magic Kingdom
The Tomorrowland Speedway – you all want to know about it – had an average wait time today of 16 minutes. Its 7-day average is 15 minutes, so today ranks #1 for this week. Its 30-day average is 15 minutes, so today ranks #10 for the past month.
Astro Orbiter had an average wait time today of 36 minutes. Its 7-day average is 28 minutes, so today ranks #1 for this week. Its 30-day average is 30 minutes, so today ranks #5 for the past month.
Buzz Lightyear’s Space Ranger Spin had an average wait time today of 38 minutes. Its 7-day average is 29 minutes, so today ranks #1 for this week. Its 30-day average is 29 minutes, so today ranks #5 for the past month. We received 5 actual wait times today, and the actual wait averaged 62% of the posted wait time.
“it’s a small world” had an average wait time today of 44 minutes. Its 7-day average is 36 minutes, so today ranks #1 for this week. Its 30-day average is 36 minutes, so today ranks #3 for the past month. We received 4 actual wait times today, and the actual wait averaged 69% of the posted wait time.
Jungle Cruise had an average wait time today of 43 minutes. Its 7-day average is 45 minutes, so today ranks #4 for this week. Its 30-day average is 41 minutes, so today ranks #11 for the past month. We received 8 actual wait times today, and the actual wait averaged 82% of the posted wait time.

Peter Pan’s Flight had an average wait time today of 39 minutes. Its 7-day average is 31 minutes, so today ranks #1 for this week. Its 30-day average is 32 minutes, so today ranks #6 for the past month. Its 365-day average is 52 minutes, so today ranks #135 for the past year.
Pirates of the Caribbean had an average wait time today of 50 minutes. Its 7-day average is 41 minutes, so today ranks #1 for this week. Its 30-day average is 43 minutes, so today ranks #8 for the past month. Its 365-day average is 42 minutes, so today ranks #71 for the past year. We received 7 actual wait times today, and the actual wait averaged 82% of the posted wait time.
Space Mountain had an average wait time today of 42 minutes. Its 7-day average is 33 minutes, so today ranks #1 for this week. Its 30-day average is 36 minutes, so today ranks #9 for the past month. Its 365-day average is 59 minutes, so today ranks #141 for the past year. We received 10 actual wait times today, and the actual wait averaged 50% of the posted wait time.
Splash Mountain had an average wait time today of 64 minutes. Its 7-day average is 47 minutes, so today ranks #1 for this week. Its 30-day average is 54 minutes, so today ranks #7 for the past month. Its 365-day average is 53 minutes, so today ranks #56 for the past year. We received 6 actual wait times today, and the actual wait averaged 60% of the posted wait time.
The Haunted Mansion had an average wait time today of 27 minutes. Its 7-day average is 22 minutes, so today ranks #1 for this week. Its 30-day average is 38 minutes, so today ranks #22 for the past month. We received 9 actual wait times today, and the actual wait averaged 85% of the posted wait time.
Seven Dwarfs Mine Train had an average wait time today of 67 minutes. Its 7-day average is 57 minutes, so today ranks #1 for this week. Its 30-day average is 57 minutes, so today ranks #6 for the past month. We received 4 actual wait times today, and the actual wait averaged 62% of the posted wait time.
EPCOT
Living with the Land had an average wait time today of 12 minutes. Its 7-day average is 13 minutes, so today ranks #4 for this week. Its 30-day average is 13 minutes, so today ranks #17 for the past month. Its 365-day average is 15 minutes, so today ranks #151 for the past year.
Mission: SPACE Orange had an average wait time today of 41 minutes. Its 7-day average is 21 minutes, so today ranks #1 for this week. Its 30-day average is 24 minutes, so today ranks #1 for the past month. Its 365-day average is 28 minutes, so today ranks #42 for the past year.
Soarin’ had an average wait time today of 50 minutes. Its 7-day average is 35 minutes, so today ranks #1 for this week. Its 30-day average is 34 minutes, so today ranks #4 for the past month. Its 365-day average is 38 minutes, so today ranks #58 for the past year. We received 4 actual wait times today, and the actual wait averaged 47% of the posted wait time.
Spaceship Earth had an average wait time today of 31 minutes. Its 7-day average is 17 minutes, so today ranks #1 for this week. Its 30-day average is 18 minutes, so today ranks #1 for the past month. Its 365-day average is 21 minutes, so today ranks #49 for the past year.
Test Track had an average wait time today of 63 minutes. Its 7-day average is 55 minutes, so today ranks #2 for this week. Its 30-day average is 59 minutes, so today ranks #13 for the past month. Its 365-day average is 58 minutes, so today ranks #80 for the past year.
The Seas with Nemo & Friends had an average wait time today of 15 minutes. Its 7-day average is 10 minutes, so today ranks #1 for this week. Its 30-day average is 12 minutes, so today ranks #5 for the past month. Its 365-day average is 17 minutes, so today ranks #118 for the past year.
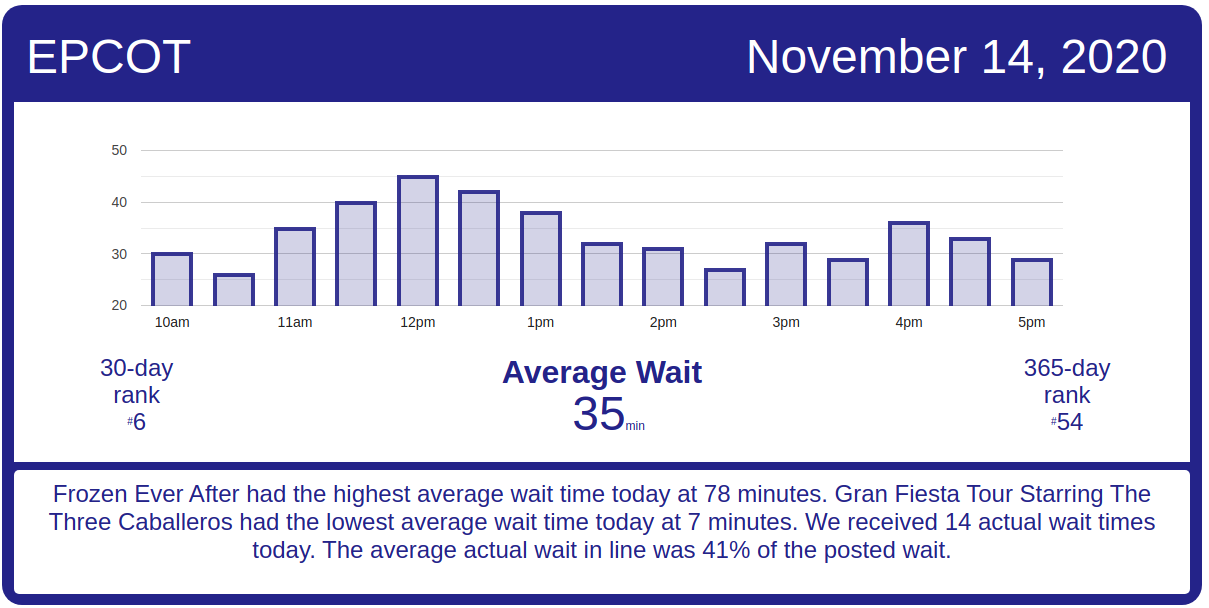
Frozen Ever After had an average wait time today of 78 minutes. Its 7-day average is 67 minutes, so today ranks #2 for this week. Its 30-day average is 65 minutes, so today ranks #6 for the past month. Its 365-day average is 58 minutes, so today ranks #39 for the past year.
The post Animal Kingdom is Packed! – Disney World Wait Times for Saturday, November 14, 2020 appeared first on TouringPlans.com Blog.
From our friends at touringplans.com
Filed Under: Walt Disney World (FL), wait times