Categories
Other

Busiest Day of the Past Month! Disney World Wait Times for Sunday, November 22, 2020

Today was the busiest day of the past month at Walt Disney World, with the Magic Kingdom and EPCOT recording their highest average posted wait times of the past 30 days, while Animal Kingdom’s tally put it as the fourth-highest of the past month. Hollywood Studios’ average wait times have been lowered by capacity increases at key rides, so posted wait time averages there don’t tell the whole story.

We received 157 actual wait times from people in lines today. Let’s do the numbers!

Magic Kingdom Wait Times

Every attraction except Dumbo the Flying Elephant posted its highest average wait time of the week today.  The good news is that the actual waits we measured at Big Thunder Mountain were only 46% of the posted wait; at Under the Sea – Journey of the Little Mermaid it was just 32% of posted; and Splash Mountain was just 63%.

Busiest Day of the Past Month! Disney World Wait Times for Sunday, November 22, 2020
Magic Kingdom wait times for Sunday, November 22, 2020
Big Thunder Mountain Railroad
Average Posted Wait
49
Actual Waits Were
46%
7-Day Rank
#1
30-Day Rank
#6
365-Day Rank
#106
Buzz Lightyear’s Space Ranger Spin
Average Posted Wait
40
7-Day Rank
#1
30-Day Rank
#2
365-Day Rank
#98
Prince Charming Regal Carrousel
Average Posted Wait
20
7-Day Rank
#1
30-Day Rank
#1
365-Day Rank
#7
Dumbo the Flying Elephant
Average Posted Wait
18
7-Day Rank
#2
30-Day Rank
#4
365-Day Rank
#112
“it’s a small world”
Average Posted Wait
43
7-Day Rank
#1
30-Day Rank
#5
365-Day Rank
#46
Jungle Cruise
Average Posted Wait
46
Actual Waits Were
103%
7-Day Rank
#1
30-Day Rank
#5
365-Day Rank
#120
Mad Tea Party
Average Posted Wait
17
7-Day Rank
#1
30-Day Rank
#3
365-Day Rank
#86
Mickey’s PhilharMagic
Average Posted Wait
28
7-Day Rank
#1
30-Day Rank
#1
365-Day Rank
#1
Peter Pan’s Flight
Average Posted Wait
41
Actual Waits Were
78%
7-Day Rank
#1
30-Day Rank
#2
365-Day Rank
#123
Pirates of the Caribbean
Average Posted Wait
47
Actual Waits Were
86%
7-Day Rank
#1
30-Day Rank
#7
365-Day Rank
#108
Space Mountain
Average Posted Wait
52
Actual Waits Were
82%
7-Day Rank
#1
30-Day Rank
#2
365-Day Rank
#117
Splash Mountain
Average Posted Wait
64
Actual Waits Were
63%
7-Day Rank
#1
30-Day Rank
#3
365-Day Rank
#54
The Barnstormer
Average Posted Wait
32
7-Day Rank
#1
30-Day Rank
#1
365-Day Rank
#75
Walt Disney’s Enchanted Tiki Room
Average Posted Wait
20
7-Day Rank
#1
30-Day Rank
#1
365-Day Rank
#1
The Haunted Mansion
Average Posted Wait
30
Actual Waits Were
74%
7-Day Rank
#1
30-Day Rank
#11
365-Day Rank
#165
The Magic Carpets of Aladdin
Average Posted Wait
18
7-Day Rank
#1
30-Day Rank
#1
365-Day Rank
#111
The Many Adventures of Winnie the Pooh
Average Posted Wait
28
7-Day Rank
#1
30-Day Rank
#3
365-Day Rank
#124
Tomorrowland Speedway
Average Posted Wait
24
7-Day Rank
#1
30-Day Rank
#1
365-Day Rank
#108
Seven Dwarfs Mine Train
Average Posted Wait
72
7-Day Rank
#1
30-Day Rank
#1
365-Day Rank
#115
Under the Sea ~ Journey of the Little Mermaid
Average Posted Wait
25
Actual Waits Were
32%
7-Day Rank
#1
30-Day Rank
#8
365-Day Rank
#117

EPCOT Wait Times

Except for Living with the Land (#9), every attraction at EPCOT had its highest average posted wait time of the past month today.  The good news is that actual wait times at Soarin’ averaged just 53% of the posted wait time when we measured them.

Busiest Day of the Past Month! Disney World Wait Times for Sunday, November 22, 2020
EPCOT wait times for Sunday, November 22, 2020.
Gran Fiesta Tour Starring The Three Caballeros
Average Posted Wait
17
7-Day Rank
#1
30-Day Rank
#1
365-Day Rank
#24
Journey Into Imagination With Figment
Average Posted Wait
32
7-Day Rank
#1
30-Day Rank
#1
365-Day Rank
#8
Living with the Land
Average Posted Wait
13
7-Day Rank
#1
30-Day Rank
#9
365-Day Rank
#123
Mission: SPACE Orange
Average Posted Wait
41
7-Day Rank
#1
30-Day Rank
#1
365-Day Rank
#43
Soarin’
Average Posted Wait
56
Actual Waits Were
53%
7-Day Rank
#1
30-Day Rank
#1
365-Day Rank
#39
Spaceship Earth
Average Posted Wait
29
7-Day Rank
#1
30-Day Rank
#1
365-Day Rank
#57
Test Track
Average Posted Wait
76
7-Day Rank
#1
30-Day Rank
#1
365-Day Rank
#35
The Seas with Nemo & Friends
Average Posted Wait
16
7-Day Rank
#1
30-Day Rank
#2
365-Day Rank
#106
Mission: SPACE Green
Average Posted Wait
20
7-Day Rank
#1
30-Day Rank
#1
365-Day Rank
#30
Frozen Ever After
Average Posted Wait
91
7-Day Rank
#1
30-Day Rank
#1
365-Day Rank
#8


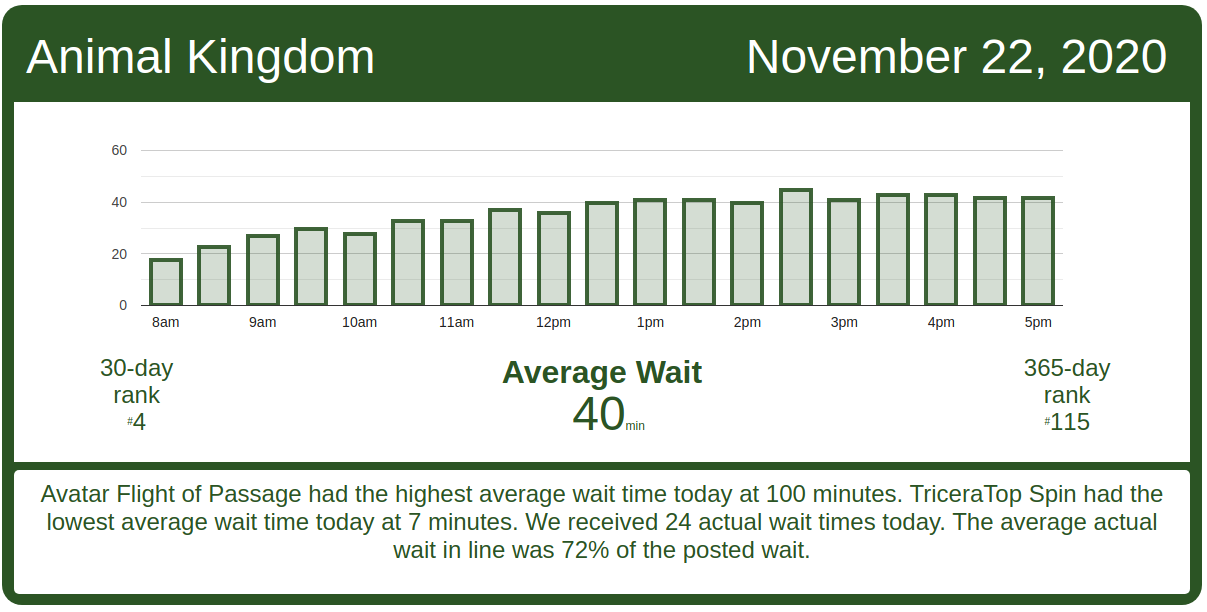
Animal Kingdom Wait Times

Every attraction at Animal Kingdom posted its highest average wait times of the past week today.  It wasn’t all bad, though – the actual waits at Kilimanjaro Safaris were just 38% of the posted wait when we measured them.  Likewise, actual waits at Expedition Everest were just 52% of the posted wait.

Busiest Day of the Past Month! Disney World Wait Times for Sunday, November 22, 2020
Animal Kingdom wait times for Sunday, November 22, 2020
DINOSAUR
Average Posted Wait
47
7-Day Rank
#1
30-Day Rank
#5
365-Day Rank
#64
Expedition Everest – Legend of the Forbidden Mountain
Average Posted Wait
47
Actual Waits Were
52%
7-Day Rank
#1
30-Day Rank
#3
365-Day Rank
#98
Kali River Rapids
Average Posted Wait
26
7-Day Rank
#1
30-Day Rank
#6
365-Day Rank
#46
Kilimanjaro Safaris
Average Posted Wait
23
Actual Waits Were
38%
7-Day Rank
#1
30-Day Rank
#9
365-Day Rank
#137
It’s Tough to Be a Bug!
Average Posted Wait
25
7-Day Rank
#1
30-Day Rank
#1
365-Day Rank
#2
TriceraTop Spin
Average Posted Wait
7
7-Day Rank
#1
30-Day Rank
#4
365-Day Rank
#83
Na’vi River Journey
Average Posted Wait
52
7-Day Rank
#1
30-Day Rank
#8
365-Day Rank
#123
Avatar Flight of Passage
Average Posted Wait
100
Actual Waits Were
82%
7-Day Rank
#1
30-Day Rank
#1
365-Day Rank
#111


Hollywood Studios Wait Times

Things weren’t quite as dire over at the Studios, but it was still busy.  Disney’s getting adjusted to estimating the actual wait at Runaway Railway, too – actual waits at Runaway Railway averaged 71% of the posted waits when we measured them today.

Busiest Day of the Past Month! Disney World Wait Times for Sunday, November 22, 2020
Hollywood Studios wait times for Sunday, November 22, 2020

Rise of the Resistance had a good day of operations calling boarding groups, with only one delay – the one that usually happens around 3 p.m.

Busiest Day of the Past Month! Disney World Wait Times for Sunday, November 22, 2020
Rise of the Resistance boarding groups for Sunday, November 22, 2020


Muppet*Vision 3D
Average Posted Wait
21
7-Day Rank
#1
30-Day Rank
#1
365-Day Rank
#1
Rock ‘n’ Roller Coaster Starring Aerosmith
Average Posted Wait
52
Actual Waits Were
59%
7-Day Rank
#1
30-Day Rank
#7
365-Day Rank
#135
Star Tours: The Adventures Continue
Average Posted Wait
25
Actual Waits Were
56%
7-Day Rank
#2
30-Day Rank
#14
365-Day Rank
#125
The Twilight Zone Tower of Terror
Average Posted Wait
46
Actual Waits Were
82%
7-Day Rank
#2
30-Day Rank
#17
365-Day Rank
#156
Toy Story Mania!
Average Posted Wait
26
Actual Waits Were
60%
7-Day Rank
#4
30-Day Rank
#18
365-Day Rank
#167
Slinky Dog Dash
Average Posted Wait
72
7-Day Rank
#1
30-Day Rank
#3
365-Day Rank
#119
Alien Swirling Saucers
Average Posted Wait
26
7-Day Rank
#4
30-Day Rank
#12
365-Day Rank
#145
Mickey & Minnie’s Runaway Railway
Average Posted Wait
51
Actual Waits Were
71%
7-Day Rank
#2
30-Day Rank
#25
365-Day Rank
#116
Millennium Falcon: Smugglers Run
Average Posted Wait
65
7-Day Rank
#1
30-Day Rank
#1
365-Day Rank
#94
Lightning McQueen’s Racing Academy
Average Posted Wait
18
7-Day Rank
#1
30-Day Rank
#1
365-Day Rank
#1

The post Busiest Day of the Past Month! Disney World Wait Times for Sunday, November 22, 2020 appeared first on TouringPlans.com Blog.

From our friends at touringplans.com

Filed Under: Walt Disney World (FL), wait times