Categories
Other

Crowds Keep Increasing – Disney World Wait Times for Tuesday, November 24, 2020

Crowds are bringing higher wait times to Walt Disney World ahead of the Thanksgiving holiday.  The Magic Kingdom and EPCOT posted their highest average wait times of the past month today, while Animal Kingdom posted its second-highest average of the past month. Hollywood Studios wasn’t less busy, either.

At the Magic Kingdom, we counted 485 of 500 people (97%) following Disney’s rules for wearing face masks.  We received 116 actual wait times today. Let’s do the numbers!


Animal Kingdom Wait Times

Every Animal Kingdom attraction except Avatar Flight of Passage reached its highest average posted wait time of the month today – and Flight of Passage’s was #2 for the month.

Crowds Keep Increasing – Disney World Wait Times for Tuesday, November 24, 2020

DINOSAUR
Average Posted Wait
58
7-Day Rank
#1
30-Day Rank
#1
365-Day Rank
#31
Expedition Everest – Legend of the Forbidden Mountain
Average Posted Wait
58
Actual Waits Were
53%
7-Day Rank
#1
30-Day Rank
#1
365-Day Rank
#75
Kali River Rapids
Average Posted Wait
48
7-Day Rank
#1
30-Day Rank
#1
365-Day Rank
#14
Kilimanjaro Safaris
Average Posted Wait
36
Actual Waits Were
51%
7-Day Rank
#1
30-Day Rank
#2
365-Day Rank
#111
It’s Tough to Be a Bug!
Average Posted Wait
34
7-Day Rank
#1
30-Day Rank
#1
365-Day Rank
#1
TriceraTop Spin
Average Posted Wait
9
7-Day Rank
#1
30-Day Rank
#3
365-Day Rank
#65
Na’vi River Journey
Average Posted Wait
59
7-Day Rank
#1
30-Day Rank
#2
365-Day Rank
#114
Avatar Flight of Passage
Average Posted Wait
91
Actual Waits Were
84%
7-Day Rank
#2
30-Day Rank
#2
365-Day Rank
#114


EPCOT Wait Times

Every EPCOT attraction except Living with the Land (#15) and Gran Fiesta Tour Starring The Three Caballeros (#10) posted its highest average wait times of the month today.

Crowds Keep Increasing – Disney World Wait Times for Tuesday, November 24, 2020
EPCOT wait times for Tuesday, November 24, 2020
Gran Fiesta Tour Starring The Three Caballeros
Average Posted Wait
10
7-Day Rank
#2
30-Day Rank
#10
365-Day Rank
#113
Journey Into Imagination With Figment
Average Posted Wait
36
7-Day Rank
#1
30-Day Rank
#1
365-Day Rank
#2
Living with the Land
Average Posted Wait
12
7-Day Rank
#3
30-Day Rank
#15
365-Day Rank
#159
Mission: SPACE Orange
Average Posted Wait
59
7-Day Rank
#1
30-Day Rank
#1
365-Day Rank
#21
Soarin’
Average Posted Wait
65
Actual Waits Were
74%
7-Day Rank
#1
30-Day Rank
#1
365-Day Rank
#26
Spaceship Earth
Average Posted Wait
32
Actual Waits Were
74%
7-Day Rank
#1
30-Day Rank
#1
365-Day Rank
#44
Test Track
Average Posted Wait
89
7-Day Rank
#1
30-Day Rank
#1
365-Day Rank
#21
The Seas with Nemo & Friends
Average Posted Wait
20
7-Day Rank
#1
30-Day Rank
#1
365-Day Rank
#71
Frozen Ever After
Average Posted Wait
97
7-Day Rank
#1
30-Day Rank
#1
365-Day Rank
#5

Hollywood Studios Wait Times

Crowds Keep Increasing – Disney World Wait Times for Tuesday, November 24, 2020
Hollywood Studios wait times for Tuesday, November 24, 2020

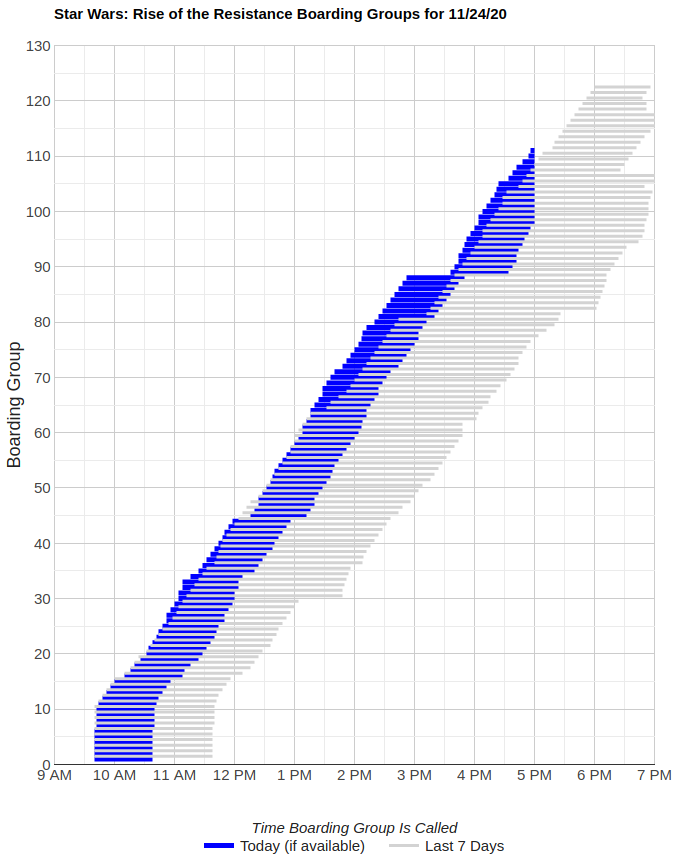
Rise of the Resistance had another solid day of operation. Rise started calling boarding groups around 9:45 a.m. and continued almost continuously until 3 p.m. (as usual), when boarding group returns were paused for around 40 minutes.  Even with that delay, boarding groups were being called earlier today than they’ve been for the past week.

Crowds Keep Increasing – Disney World Wait Times for Tuesday, November 24, 2020
Rise of the Resistance boarding groups for Tuesday, November 24, 2020
Muppet*Vision 3D
Average Posted Wait
19
7-Day Rank
#1
30-Day Rank
#1
365-Day Rank
#1
Rock ‘n’ Roller Coaster Starring Aerosmith
Average Posted Wait
51
Actual Waits Were
82%
7-Day Rank
#1
30-Day Rank
#9
365-Day Rank
#140
Star Tours: The Adventures Continue
Average Posted Wait
23
7-Day Rank
#4
30-Day Rank
#21
365-Day Rank
#145
The Twilight Zone Tower of Terror
Average Posted Wait
43
Actual Waits Were
78%
7-Day Rank
#2
30-Day Rank
#20
365-Day Rank
#172
Toy Story Mania!
Average Posted Wait
26
Actual Waits Were
67%
7-Day Rank
#4
30-Day Rank
#18
365-Day Rank
#167
Slinky Dog Dash
Average Posted Wait
77
7-Day Rank
#1
30-Day Rank
#1
365-Day Rank
#93
Alien Swirling Saucers
Average Posted Wait
23
7-Day Rank
#6
30-Day Rank
#19
365-Day Rank
#170
Mickey & Minnie’s Runaway Railway
Average Posted Wait
44
Actual Waits Were
63%
7-Day Rank
#5
30-Day Rank
#28
365-Day Rank
#137
Millennium Falcon: Smugglers Run
Average Posted Wait
49
Actual Waits Were
89%
7-Day Rank
#3
30-Day Rank
#19
365-Day Rank
#175


Magic Kingdom Wait Times

Every major attraction at the Magic Kingdom set new monthly highs for average posted wait times today. Actual wait times we received ranged from 52% to 72% of the posted waits.

Crowds Keep Increasing – Disney World Wait Times for Tuesday, November 24, 2020
Magic Kingdom wait times for Tuesday, November 24, 2020
Astro Orbiter
Average Posted Wait
48
7-Day Rank
#1
30-Day Rank
#1
365-Day Rank
#5
Big Thunder Mountain Railroad
Average Posted Wait
62
7-Day Rank
#1
30-Day Rank
#1
365-Day Rank
#66
Buzz Lightyear’s Space Ranger Spin
Average Posted Wait
43
7-Day Rank
#1
30-Day Rank
#1
365-Day Rank
#88
Dumbo the Flying Elephant
Average Posted Wait
21
7-Day Rank
#1
30-Day Rank
#2
365-Day Rank
#96
“it’s a small world”
Average Posted Wait
42
7-Day Rank
#3
30-Day Rank
#8
365-Day Rank
#55
Jungle Cruise
Average Posted Wait
47
7-Day Rank
#1
30-Day Rank
#6
365-Day Rank
#114
Mad Tea Party
Average Posted Wait
22
7-Day Rank
#1
30-Day Rank
#1
365-Day Rank
#47
Mickey’s PhilharMagic
Average Posted Wait
34
7-Day Rank
#1
30-Day Rank
#1
365-Day Rank
#1
Peter Pan’s Flight
Average Posted Wait
47
7-Day Rank
#1
30-Day Rank
#1
365-Day Rank
#112
Pirates of the Caribbean
Average Posted Wait
54
Actual Waits Were
72%
7-Day Rank
#1
30-Day Rank
#1
365-Day Rank
#48
Space Mountain
Average Posted Wait
62
Actual Waits Were
68%
7-Day Rank
#1
30-Day Rank
#1
365-Day Rank
#95
Splash Mountain
Average Posted Wait
76
7-Day Rank
#1
30-Day Rank
#1
365-Day Rank
#36
The Barnstormer
Average Posted Wait
31
7-Day Rank
#2
30-Day Rank
#2
365-Day Rank
#78
The Haunted Mansion
Average Posted Wait
43
7-Day Rank
#1
30-Day Rank
#4
365-Day Rank
#129
The Magic Carpets of Aladdin
Average Posted Wait
17
7-Day Rank
#3
30-Day Rank
#3
365-Day Rank
#119
The Many Adventures of Winnie the Pooh
Average Posted Wait
29
Actual Waits Were
58%
7-Day Rank
#1
30-Day Rank
#2
365-Day Rank
#115
Tomorrowland Speedway
Average Posted Wait
14
7-Day Rank
#6
30-Day Rank
#18
365-Day Rank
#168
Seven Dwarfs Mine Train
Average Posted Wait
85
7-Day Rank
#1
30-Day Rank
#1
365-Day Rank
#102
Under the Sea ~ Journey of the Little Mermaid
Average Posted Wait
28
Actual Waits Were
52%
7-Day Rank
#1
30-Day Rank
#3
365-Day Rank
#92

The post Crowds Keep Increasing – Disney World Wait Times for Tuesday, November 24, 2020 appeared first on TouringPlans.com Blog.

From our friends at touringplans.com

Filed Under: Walt Disney World (FL), wait times