All four Walt Disney World parks’ average wait times today were in the lower half of their monthly averages. And when you consider that actual wait times (we got 177 of them today!) were under 70% of the posted waits, it was even better to be in the parks today. We counted 493 of 500 people (99%) wearing masks according to Disney’s guidelines. Let’s do the numbers!
Hollywood Studios Wait Times
Mickey & Minnie’s Runaway Railway had an average wait time today of 49 minutes. Its 7-day average is 68 minutes – some of those days were before the installation of plexiglass dividers on the ride vehicles – so today ranks #5 for this week. Its 30-day average is 76 minutes, so today ranks #28 for the past month. Its 365-day average is 71 minutes, so today ranks #122 for the past year. We received 6 actual wait times today, and the actual wait averaged 74% of the posted wait time.
An interesting side effect of the lower wait at Runaway Railway is that actual wait times at Slinky Dog Dash are closer to the posted wait time now. Slinky Dog had an average wait time today of 72 minutes. Its 7-day average is 66 minutes, so today ranks #1 for this week. Its 30-day average is 65 minutes, so today ranks #3 for the past month. We received 4 actual wait times today at Slinky, and the actual wait averaged 101% of the posted wait time. Yesterday was 85%. For comparison, the same days last week were 65% and 72%.

Rock ‘n’ Roller Coaster Starring Adele (really Aerosmith) had an average wait time today of 48 minutes. Its 7-day average is 49 minutes, so today ranks #4 for this week. Its 30-day average is 50 minutes, so today ranks #21 for the past month.
Star Tours: The Adventures Continue had an average wait time today of 25 minutes. Its 7-day average is 25 minutes, so today ranks #4 for this week. Its 30-day average is 27 minutes, so today ranks #18 for the past month.
The Twilight Zone Tower of Terror had an average wait time today of 43 minutes. Its 7-day average is 45 minutes, so today ranks #4 for this week. Its 30-day average is 48 minutes, so today ranks #22 for the past month. We received 5 actual wait times today, and the actual wait averaged 74% of the posted wait time.
Toy Story Mania! had an average wait time today of 28 minutes. Its 7-day average is 28 minutes, so today ranks #3 for this week. Its 30-day average is 28 minutes, so today ranks #16 for the past month. Its 365-day average is 43 minutes, so today ranks #154 for the past year. We received 7 actual wait times today, and the actual wait averaged 50% of the posted wait time.
Rise of the Resistance had another solid day of operation. There was only one small delay in calling boarding groups at Rise, and that was for about half an hour around 3 p.m. But overall, great job by the park ops team again.

Animal Kingdom Wait Times
DINOSAUR had an average wait time today of 35 minutes. Its 7-day average is 32 minutes, so today ranks #3 for this week. Its 30-day average is 28 minutes, so today ranks #9 for the past month.
Expedition Everest – Legend of the Forbidden Mountain had an average wait time today of 22 minutes. Its 7-day average is 32 minutes, so today ranks #4 for this week. Its 30-day average is 31 minutes, so today ranks #22 for the past month. We received 4 actual wait times today, and the actual wait averaged 42% of the posted wait time.
Kali River Rapids had an average wait time today of 12 minutes. Its 7-day average is 22 minutes, so today ranks #5 for this week. Its 30-day average is 19 minutes, so today ranks #26 for the past month.
Kilimanjaro Safaris had an average wait time today of 16 minutes. Its 7-day average is 25 minutes, so today ranks #6 for this week. Its 30-day average is 22 minutes, so today ranks #22 for the past month. We received 4 actual wait times today, and the actual wait averaged 46% of the posted wait time.
Na’vi River Journey had an average wait time today of 48 minutes. Its 7-day average is 53 minutes, so today ranks #4 for this week. Its 30-day average is 47 minutes, so today ranks #10 for the past month.
Avatar Flight of Passage had an average wait time today of 45 minutes. Its 7-day average is 61 minutes, so today ranks #6 for this week. Its 30-day average is 54 minutes, so today ranks #21 for the past month. We received 6 actual wait times today, and the actual wait averaged 77% of the posted wait time.

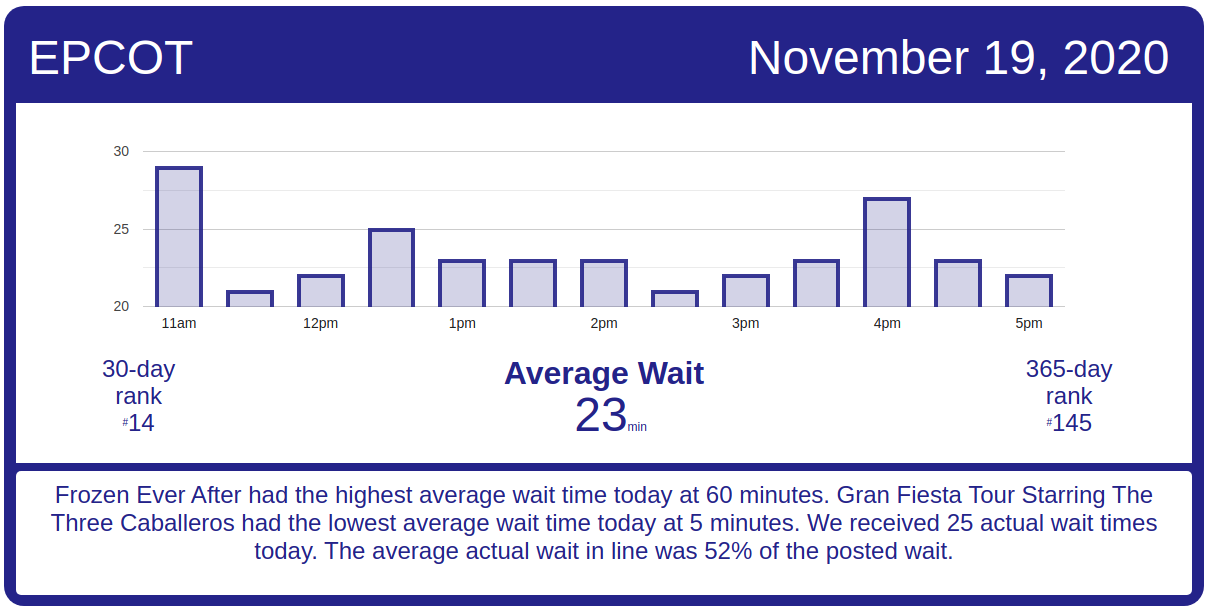
EPCOT Wait Times
Frozen Ever After had an average wait time today of 60 minutes – however we received 4 actual wait times today, and the actual wait averaged 52% of the posted wait time.. Its 7-day average is 65 minutes, so today ranks #5 for this week. Its 30-day average is 64 minutes, so today ranks #17 for the past month.
Living with the Land had an average wait time today of 10 minutes. Its 7-day average is 11 minutes, so today ranks #4 for this week. Its 30-day average is 12 minutes, so today ranks #25 for the past month.
Soarin’ had an average wait time today of 54 minutes. Its 7-day average is 34 minutes, so today ranks #1 for this week. Its 30-day average is 33 minutes, so today ranks #2 for the past month. Its 365-day average is 38 minutes, so today ranks #44 for the past year. We received 4 actual wait times today, and the actual wait averaged 89% of the posted wait time.
Spaceship Earth had an average wait time today of 10 minutes. Its 7-day average is 20 minutes, so today ranks #6 for this week. Its 30-day average is 18 minutes, so today ranks #27 for the past month. Its 365-day average is 21 minutes, so today ranks #183 for the past year. We received 6 actual wait times today, and the actual wait averaged 63% of the posted wait time.
Test Track had an average wait time today of 42 minutes. Its 7-day average is 54 minutes, so today ranks #6 for this week. Its 30-day average is 56 minutes, so today ranks #27 for the past month. Its 365-day average is 58 minutes, so today ranks #139 for the past year. We received 8 actual wait times today, and the actual wait averaged 41% of the posted wait time.
Mission: SPACE Orange had an average wait time today of 11 minutes. Its 7-day average is 25 minutes, so today ranks #6 for this week. Its 30-day average is 23 minutes, so today ranks #29 for the past month. Its 365-day average is 28 minutes, so today ranks #243 for the past year.
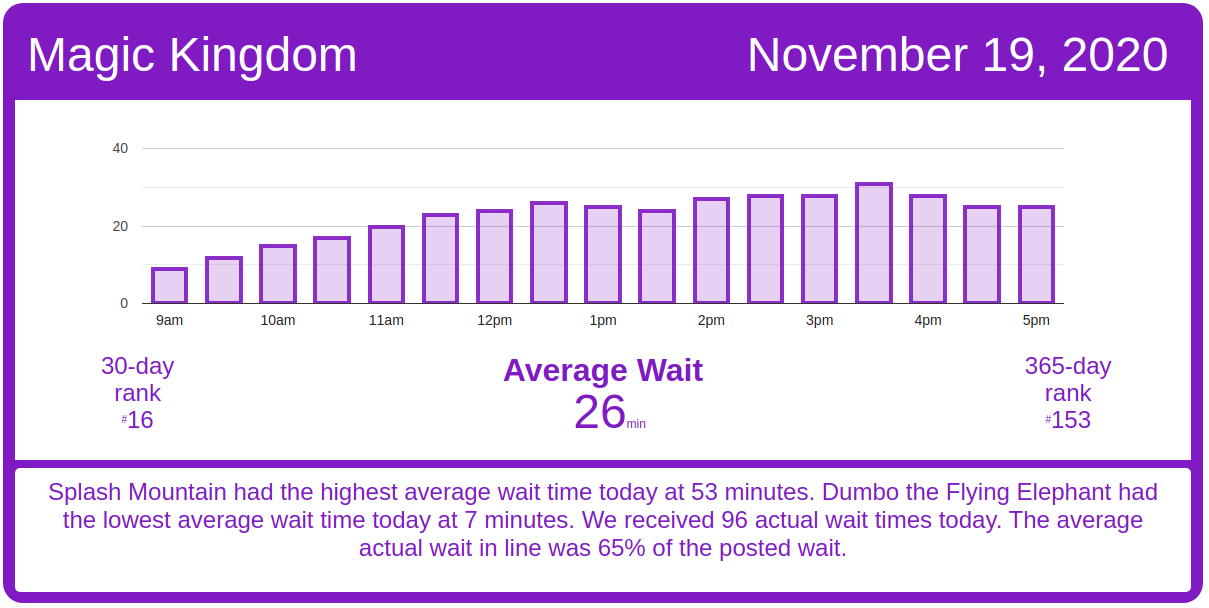
Magic Kingdom Wait Times
The Many Adventures of Winnie the Pooh had an average wait time today of 19 minutes. Its 7-day average is 25 minutes, so today ranks #6 for this week. Its 30-day average is 23 minutes, so today ranks #23 for the past month. Its 365-day average is 30 minutes, so today ranks #189 for the past year. We received 4 actual wait times today, and the actual wait averaged 49% of the posted wait time.
Seven Dwarfs Mine Train had an average wait time today of 53 minutes. Its 7-day average is 63 minutes, so today ranks #6 for this week. Its 30-day average is 56 minutes, so today ranks #19 for the past month. Its 365-day average is 80 minutes, so today ranks #161 for the past year. We received 8 actual wait times today, and the actual wait averaged 76% of the posted wait time.
Under the Sea ~ Journey of the Little Mermaid had an average wait time today of 9 minutes. Its 7-day average is 22 minutes, so today ranks #6 for this week. Its 30-day average is 21 minutes, so today ranks #27 for the past month. Its 365-day average is 23 minutes, so today ranks #204 for the past year. We received 5 actual wait times today, and the actual wait averaged 55% of the posted wait time.
Peter Pan’s Flight had an average wait time today of 27 minutes. Its 7-day average is 33 minutes, so today ranks #6 for this week. Its 30-day average is 31 minutes, so today ranks #21 for the past month. Its 365-day average is 52 minutes, so today ranks #180 for the past year. We received 8 actual wait times today, and the actual wait averaged 90% of the posted wait time.
Pirates of the Caribbean had an average wait time today of 33 minutes. Its 7-day average is 44 minutes, so today ranks #6 for this week. Its 30-day average is 41 minutes, so today ranks #24 for the past month. Its 365-day average is 42 minutes, so today ranks #179 for the past year. We received 6 actual wait times today, and the actual wait averaged 79% of the posted wait time.
Space Mountain had an average wait time today of 26 minutes. Its 7-day average is 34 minutes, so today ranks #4 for this week. Its 30-day average is 33 minutes, so today ranks #19 for the past month. Its 365-day average is 59 minutes, so today ranks #174 for the past year. We received 5 actual wait times today, and the actual wait averaged 53% of the posted wait time.
Splash Mountain had an average wait time today of 53 minutes. Its 7-day average is 53 minutes, so today ranks #4 for this week. Its 30-day average is 51 minutes, so today ranks #12 for the past month. Its 365-day average is 53 minutes, so today ranks #88 for the past year. We received 11 actual wait times today, and the actual wait averaged 57% of the posted wait time.
The Haunted Mansion had an average wait time today of 17 minutes. Its 7-day average is 24 minutes, so today ranks #6 for this week. Its 30-day average is 33 minutes, so today ranks #28 for the past month. Its 365-day average is 44 minutes, so today ranks #210 for the past year. We received 7 actual wait times today, and the actual wait averaged 63% of the posted wait time.
Big Thunder Mountain Railroad had an average wait time today of 40 minutes. Its 7-day average is 46 minutes, so today ranks #6 for this week. Its 30-day average is 44 minutes, so today ranks #18 for the past month. Its 365-day average is 52 minutes, so today ranks #156 for the past year. We received 9 actual wait times today, and the actual wait averaged 43% of the posted wait time.
Buzz Lightyear’s Space Ranger Spin had an average wait time today of 22 minutes. Its 7-day average is 32 minutes, so today ranks #6 for this week. Its 30-day average is 28 minutes, so today ranks #22 for the past month. Its 365-day average is 35 minutes, so today ranks #175 for the past year. We received 8 actual wait times today, and the actual wait averaged 54% of the posted wait time.
Jungle Cruise had an average wait time today of 37 minutes. Its 7-day average is 44 minutes, so today ranks #6 for this week. Its 30-day average is 41 minutes, so today ranks #21 for the past month. Its 365-day average is 52 minutes, so today ranks #172 for the past year. We received 7 actual wait times today, and the actual wait averaged 103% of the posted wait time.
And finally, a word from our sponsor:
If you’re planning on visiting Walt Disney World this holiday season, you’ll need a special tool at your side. Subscribe today and get our Lines app too.

The post Pretty Low Wait Times Today at Walt Disney World – Thursday, November 19, 2020 appeared first on TouringPlans.com Blog.
From our friends at touringplans.com
Filed Under: Walt Disney World (FL), wait times