Today was a good day for short lines across most of Walt Disney World, with posted wait times at EPCOT, Magic Kingdom, and Animal Kingdom near their 30-day lows, while the average wait at Hollywood Studios was just middle of the pack for the month. Let’s do the numbers.
EPCOT Wait Times
Soarin’ had an average wait time today of 27 minutes, which is 8 minutes below its 7-day average. That puts today in the #5 spot for the past week. Soarin’s 30-day average is 37 minutes, so today ranks #21 for the past month. We received only 4 actual wait times today at Soarin’, and the actual wait averaged 61% of the posted wait time.
Test Track had an average wait time today of 42 minutes, well below its 7-day average of 65 minutes (#6 for the week) and also way below its 30-day average of 64 minutes (#27 for the past month). Its 365-day average is 58 minutes, so today ranks #143 for the past year. We received 4 actual wait times today at Test Track, and the actual wait averaged 73% of the posted wait time.

It was a slow day at Mission: SPACE Green, whose average wait time today of 5 minutes was #6 for the week, #29 for the past month. and #244 for the past year.
A similar story over at Living with the Land, which had an average posted wait time of 9 minutes. Its 7-day average is 14 minutes, so today is #6 for this week. Its 30-day average is 13 minutes, so today was #25 for the past month. Its 365-day average is 15 minutes, so today ranks #218 for the past year.
Over at Frozen Ever After, we saw an average wait time today of 41 minutes (#6 week / #29 month / #190 year). It didn’t feel overly humid in the parks today either, so all in all a nice day to be in the world’s greatest theme park.
If you’ve got to visit during a busy weekend, have a special tool at your side. Subscribe today and get our Lines app too.
Hollywood Studios Wait Times
The Studios was the busiest of the Walt Disney World parks today, if you’re looking at how each park’s wait times compared over the past month. Mickey & Minnie’s Runaway Railway had an average wait time today of 82 minutes. Its 7-day average is 86 minutes, so today ranks #4 for this week. Its 30-day average is 83 minutes, so today ranks #19 for the past month.
Rock ‘n’ Roller Coaster had an average wait time today of 53 minutes. Its 7-day average is 54 minutes, so today ranks #5 for this week. Its 30-day average is 52 minutes, meaning today ranks #15 for the past month. And Tower of Terror’s average wait time today was 47 minutes (#3 week / #17 month).
One attraction that was relatively busy at the Studios was Star Tours: The Adventures Continue, which had an average posted wait of 41 minutes. Its 7-day average is 31 minutes, so today ranks #1 for this week. Its 30-day average is 29 minutes, so today ranks #1 for the past month, and 41 minutes is good for #30 over the past year.

Today’s weird statistic: Muppet*Vision 3D had an average wait time today of 36 minutes. Despite virtually all other Walt Disney World attractions having relatively short waits, an average 36-minute wait at Muppets is good for #1 over the past year (as of 5 p.m. today, anyway). If this and Star Tours can somehow inspire a Muppets/Mandalorian collab, Disney will make Hollywood Studios – the world’s greatest theme park – even better.
Slinky Dog Dash had an average wait time today of 67 minutes. Its 7-day average is 69 minutes, so today ranks #4 for this week. Its 30-day average is 68 minutes, so today ranks #19 for the past month. Its 365-day average is 76 minutes, so today ranks #154 for the past year.
Speaking of Star Wars, Rise of the Resistance started off strong, with boarding groups 1 to 15 called about as early as we’ve seen them called over the past week. Things started to slow down around 11:15 a.m., and by 4 p.m., boarding groups 50 through 55 were ending just a bit later than they have all week. As you can tell from the chart below, boarding groups were called towards the later end of their 7-day average from about 3:30 p.m. onward.

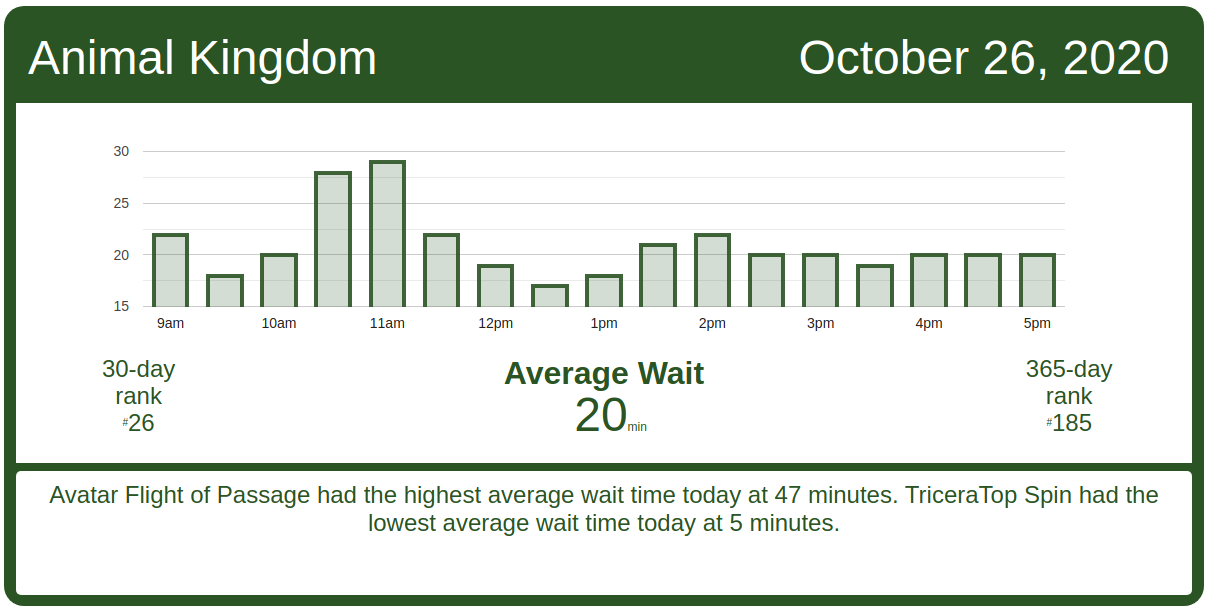
Animal Kingdom Wait Times
Expedition Everest – Legend of the Forbidden Mountain had an average wait time today of 20 minutes. Its 7-day average is 35 minutes, so today ranks #6 for this week. Its 30-day average is 32 minutes, so today ranks #24 for the past month. Its 365-day average is 47 minutes, so today ranks #195 for the past year. And although it was pretty warm out today, there wasn’t much of a line for Kali River Rapids. Kali’s average wait time today was 13 minutes (#5 week / #27 month / #115 year).
Kilimanjaro Safaris had an average wait time today of 13 minutes. Its 7-day average is 22 minutes, so today ranks #6 for this week. Its 30-day average is 22 minutes, so today ranks #26 for the past month.
In Pandora, Na’vi River Journey had an average wait time today of 39 minutes. Its 7-day average is 49 minutes, so today ranks #6 for this week. Its 30-day average is 46 minutes, so today ranks #24 for the past month. And Avatar Flight of Passage had an average wait time today of 47 minutes. Its 7-day average is 69 minutes, so today ranks #6 for this week. Its 30-day average is 63 minutes, so today ranks #22 for the past month. All in all, a good day to be surrounded by the verdant landscaping and excellent attractions in the world’s greatest theme park.
Magic Kingdom Wait Times
No surprise that Seven Dwarfs Mine Train had the longest waits of the day today. 7DMT’s average wait time today was 51 minutes – that’s #5 for the week, #25 for the month, and #174 for the year. Those posted wait times were reasonably accurate, too – we received 5 actual wait times today and the actual wait averaged 73% of the posted wait time.

The Haunted Mansion had an average posted wait time today of 43 minutes, but had some technical difficulties during the day. We received 7 actual wait times today, and the actual wait averaged 42% of the posted wait time, so if you saw a high wait time at Mansion today, it might’ve been Disney’s way of telling you to go somewhere else. As it is, Mansion’s 7-day average is 45 minutes, so today ranks #4 for this week. Its 30-day average is 45 minutes, so today ranks #19 for the past month.
Peter Pan’s Flight had an average wait time today of 31 minutes. Its 7-day average is 33 minutes, so today ranks #3 for this week. Its 30-day average is 35 minutes, so today ranks #20 for the past month. Its 365-day average is 54 minutes, so today ranks #174 for the past year. We received 5 actual wait times today, and the actual wait averaged 69% of the posted wait time.
Space Mountain had an average wait time today of 30 minutes. Its 7-day average is 40 minutes, so today ranks #5 for this week. Its 30-day average is 43 minutes, so today ranks #24 for the past month. We received 8 actual wait times today, and the actual wait averaged 54% of the posted wait time. So again, probably not as busy as the wait time signs would indicate.
Splash Mountain had an average wait time today of 48 minutes. Its 7-day average is 60 minutes, so today ranks #5 for this week. Its 30-day average is 64 minutes, so today ranks #25 for the past month. We received 8 actual wait times today, and the actual wait averaged 91% of the posted wait time, and that’s really accurate.
Pirates of the Caribbean had an average wait time today of 40 minutes. Its 7-day average is 46 minutes, so today ranks #5 for this week. Its 30-day average is 50 minutes, so today ranks #28 for the past month. Its 365-day average is 42 minutes, so today ranks #148 for the past year.
Other rides in the world’s greatest theme park:
- Jungle Cruise had an average wait time today of 31 minutes. Its 7-day average is 42 minutes, so today ranks #6 for this week.
- Big Thunder Mountain Railroad had an average wait time today of 38 minutes. Its 7-day average is 47 minutes, so today ranks #5 for this week.
- Buzz Lightyear’s Space Ranger Spin had an average wait time today of 29 minutes. Its 7-day average is 32 minutes, so today ranks #4 for this week.
- Walt Disney’s Carousel of Progress had an average wait time today of 5 minutes. A new Scene 4 would draw the crowds, wouldn’t it?
Love these daily data discussions? Let us know what you think in the comments.
The post Shorter Lines to Start the Week – Walt Disney World Wait Times for Monday, October 26, 2020 appeared first on TouringPlans.com Blog.
From our friends at touringplans.com
Filed Under: Walt Disney World (FL), wait times