Categories
Other

Crowds Ahoy! Walt Disney World Wait Times for Wednesday, November 25, 2020

Any doubts about whether crowds would visit Walt Disney World for Thanksgiving were dispelled today, as the Magic Kingdom, EPCOT, and Animal Kingdom saw posted wait time averages in the top 3 of the past month.  Hollywood Studios was equally busy, but wait times are lower because of ride capacity that was added a couple of weeks ago.

Many Walt Disney World computer systems experienced issues today, including My Disney Experience and park tapstiles. It’s safe to assume this was related to an Amazon Web Services outage in the eastern part of the U.S.

We received exactly 200 actual wait times today from our Lines app Liners – thank you all. Let’s do the numbers!

Animal Kingdom Wait Times

The average posted wait for Avatar Flight of Passage hit two hours today. That 120 minutes may seem like a lot, but at #99 it’s barely in the top 100 days of the past year for FoP (and that counts days lost to the shutdown).  In good news, the actual wait times we measured at Expedition Everest and Kilimanjaro Safari were only half of the posted wait times.

Crowds Ahoy! Walt Disney World Wait Times for Wednesday, November 25, 2020
Animal Kingdom crowds for Wednesday, November 25, 2020
DINOSAUR
Average Posted Wait
65
Actual Waits Were
82%
7-Day Rank
#1
30-Day Rank
#1
365-Day Rank
#17
Expedition Everest – Legend of the Forbidden Mountain
Average Posted Wait
49
Actual Waits Were
50%
7-Day Rank
#2
30-Day Rank
#3
365-Day Rank
#88
Kali River Rapids
Average Posted Wait
45
7-Day Rank
#1
30-Day Rank
#1
365-Day Rank
#15
Kilimanjaro Safaris
Average Posted Wait
33
Actual Waits Were
50%
7-Day Rank
#2
30-Day Rank
#6
365-Day Rank
#116
It’s Tough to Be a Bug!
Average Posted Wait
35
7-Day Rank
#1
30-Day Rank
#1
365-Day Rank
#1
TriceraTop Spin
Average Posted Wait
7
7-Day Rank
#2
30-Day Rank
#5
365-Day Rank
#83
Na’vi River Journey
Average Posted Wait
64
Actual Waits Were
83%
7-Day Rank
#1
30-Day Rank
#1
365-Day Rank
#104
Avatar Flight of Passage
Average Posted Wait
120
Actual Waits Were
86%
7-Day Rank
#1
30-Day Rank
#1
365-Day Rank
#99

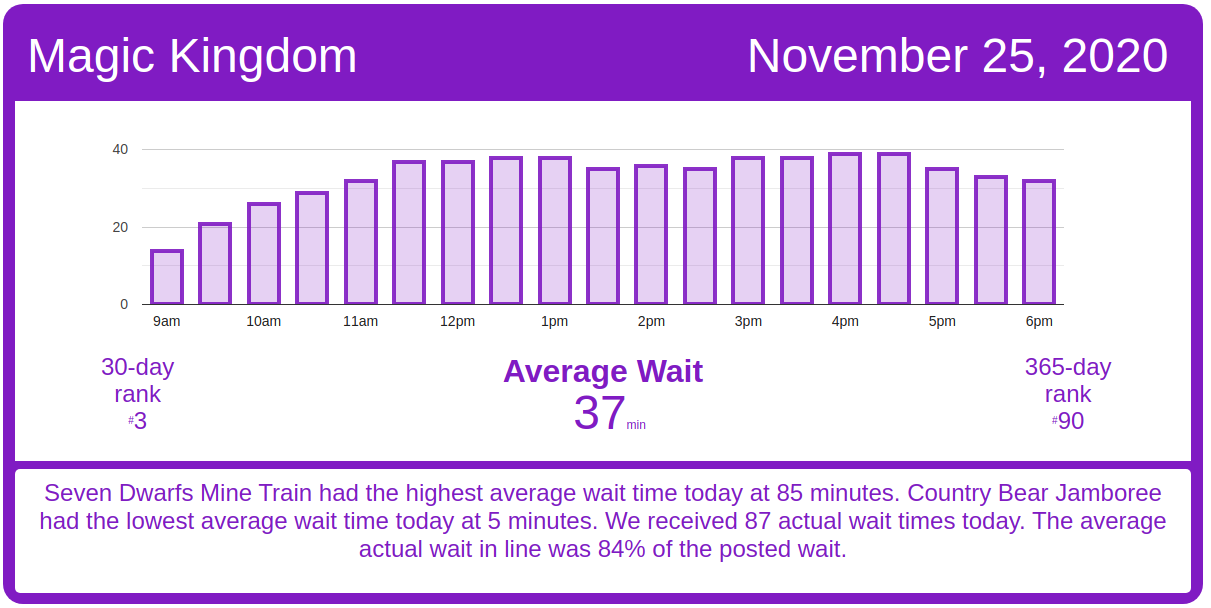
Magic Kingdom Wait Times

Not only was the Magic Kingdom busy today, but the posted wait times were pretty close to actual waits in line we measured throughout the park.  There’s something to be said for truth in advertising.  One bright spot at the Magic Kingdom was that the average wait to get into Country Bear Jamboree – the world’s best ursine-based animatronic stage show with country and western music – was only 5 minutes.

Crowds Ahoy! Walt Disney World Wait Times for Wednesday, November 25, 2020
Magic Kingdom crowds for Wednesday, November 25, 2020
Astro Orbiter
Average Posted Wait
38
7-Day Rank
#5
30-Day Rank
#8
365-Day Rank
#53
Big Thunder Mountain Railroad
Average Posted Wait
54
Actual Waits Were
72%
7-Day Rank
#2
30-Day Rank
#4
365-Day Rank
#88
Buzz Lightyear’s Space Ranger Spin
Average Posted Wait
40
Actual Waits Were
46%
7-Day Rank
#3
30-Day Rank
#4
365-Day Rank
#100
Country Bear Jamboree
Average Posted Wait
5
7-Day Rank
#1
30-Day Rank
#6
365-Day Rank
#134
Dumbo the Flying Elephant
Average Posted Wait
16
7-Day Rank
#4
30-Day Rank
#7
365-Day Rank
#120
“it’s a small world”
Average Posted Wait
40
Actual Waits Were
105%
7-Day Rank
#4
30-Day Rank
#10
365-Day Rank
#66
Jungle Cruise
Average Posted Wait
50
Actual Waits Were
108%
7-Day Rank
#1
30-Day Rank
#3
365-Day Rank
#106
Mad Tea Party
Average Posted Wait
15
7-Day Rank
#3
30-Day Rank
#8
365-Day Rank
#99
Mickey’s PhilharMagic
Average Posted Wait
28
7-Day Rank
#1
30-Day Rank
#1
365-Day Rank
#1
Peter Pan’s Flight
Average Posted Wait
37
Actual Waits Were
65%
7-Day Rank
#4
30-Day Rank
#8
365-Day Rank
#136
Pirates of the Caribbean
Average Posted Wait
52
Actual Waits Were
86%
7-Day Rank
#2
30-Day Rank
#3
365-Day Rank
#62
Space Mountain
Average Posted Wait
66
Actual Waits Were
55%
7-Day Rank
#1
30-Day Rank
#1
365-Day Rank
#94
Splash Mountain
Average Posted Wait
68
7-Day Rank
#2
30-Day Rank
#3
365-Day Rank
#48
The Barnstormer
Average Posted Wait
28
7-Day Rank
#4
30-Day Rank
#4
365-Day Rank
#89
Walt Disney’s Enchanted Tiki Room
Average Posted Wait
15
7-Day Rank
#1
30-Day Rank
#1
365-Day Rank
#1
The Haunted Mansion
Average Posted Wait
26
Actual Waits Were
91%
7-Day Rank
#3
30-Day Rank
#15
365-Day Rank
#181
The Magic Carpets of Aladdin
Average Posted Wait
13
7-Day Rank
#4
30-Day Rank
#13
365-Day Rank
#158
The Many Adventures of Winnie the Pooh
Average Posted Wait
26
Actual Waits Were
62%
7-Day Rank
#4
30-Day Rank
#8
365-Day Rank
#135
Tomorrowland Speedway
Average Posted Wait
15
Actual Waits Were
67%
7-Day Rank
#6
30-Day Rank
#18
365-Day Rank
#159
Seven Dwarfs Mine Train
Average Posted Wait
85
Actual Waits Were
107%
7-Day Rank
#1
30-Day Rank
#1
365-Day Rank
#101
Under the Sea ~ Journey of the Little Mermaid
Average Posted Wait
26
Actual Waits Were
68%
7-Day Rank
#2
30-Day Rank
#6
365-Day Rank
#106

Hollywood Studios Wait Times

The big thing we saw at the Studios today was that the posted wait time at Millennium Falcon: Smugglers Run was underestimated by a fairly wide amount.  Smugglers Run’s average wait time today was 45 minutes. We received 8 actual wait times today, and the actual wait averaged 149% of the posted wait time – so that average posted of 45 minutes was an actual of almost 70 minutes.

Crowds Ahoy! Walt Disney World Wait Times for Wednesday, November 25, 2020
Hollywood Studios crowds for Wednesday, November 25, 2020

Rise of the Resistance was running really well until the AWS outage just after 1 p.m., and that resulted in an hour-long delay in calling boarding groups.  Things resumed around 2:15 p.m. and seemed to run well for a bit before calling boarding groups slowed down from around 3 p.m. to just before 5 p.m.  Things look better as I’m writing this, though, so hopefully everyone who got a boarding group will get a chance to ride the best attraction Disney’s done in decades.
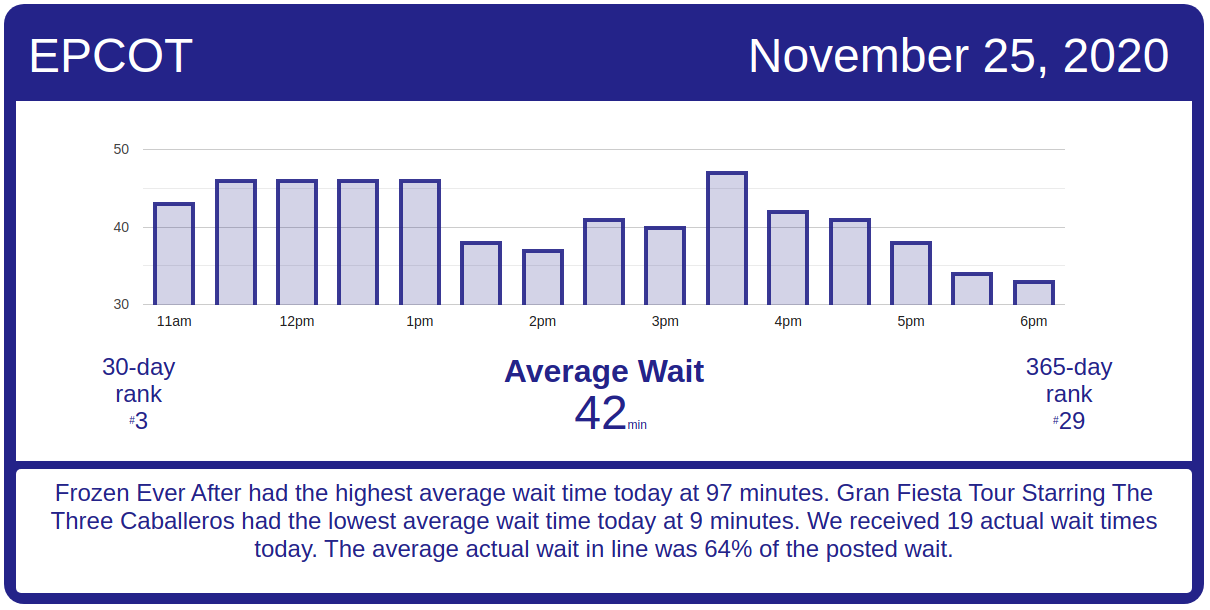
Crowds Ahoy! Walt Disney World Wait Times for Wednesday, November 25, 2020
Rise of the Resistance boarding groups for Wednesday, November 25, 2020
Muppet*Vision 3D
Average Posted Wait
17
7-Day Rank
#1
30-Day Rank
#1
365-Day Rank
#1
Rock ‘n’ Roller Coaster Starring Aerosmith
Average Posted Wait
54
Actual Waits Were
77%
7-Day Rank
#1
30-Day Rank
#6
365-Day Rank
#127
Star Tours: The Adventures Continue
Average Posted Wait
23
Actual Waits Were
39%
7-Day Rank
#3
30-Day Rank
#20
365-Day Rank
#143
The Twilight Zone Tower of Terror
Average Posted Wait
63
Actual Waits Were
79%
7-Day Rank
#1
30-Day Rank
#1
365-Day Rank
#80
Toy Story Mania!
Average Posted Wait
24
Actual Waits Were
77%
7-Day Rank
#5
30-Day Rank
#22
365-Day Rank
#176
Slinky Dog Dash
Average Posted Wait
74
7-Day Rank
#1
30-Day Rank
#2
365-Day Rank
#107
Alien Swirling Saucers
Average Posted Wait
27
Actual Waits Were
81%
7-Day Rank
#1
30-Day Rank
#5
365-Day Rank
#127
Mickey & Minnie’s Runaway Railway
Average Posted Wait
44
Actual Waits Were
70%
7-Day Rank
#5
30-Day Rank
#28
365-Day Rank
#137
Millennium Falcon: Smugglers Run
Average Posted Wait
45
Actual Waits Were
149%
7-Day Rank
#7
30-Day Rank
#29
365-Day Rank
#187
Lightning McQueen’s Racing Academy
Average Posted Wait
17
7-Day Rank
#1
30-Day Rank
#1
365-Day Rank
#1

EPCOT Wait Times

Sure, EPCOT was crowded, but the Mexico pavilion’s Gran Fiesta Tour only had an average wait of 9 minutes.  My guess is that everyone was celebrating the birthday of La Cava’s tequila ambassador, Hilda, with margaritas and shots.

Crowds Ahoy! Walt Disney World Wait Times for Wednesday, November 25, 2020
EPCOT crowds for Wednesday, November 25, 2020
Gran Fiesta Tour Starring The Three Caballeros
Average Posted Wait
9
7-Day Rank
#2
30-Day Rank
#12
365-Day Rank
#130
Journey Into Imagination With Figment
Average Posted Wait
21
7-Day Rank
#4
30-Day Rank
#6
365-Day Rank
#62
Living with the Land
Average Posted Wait
10
7-Day Rank
#5
30-Day Rank
#25
365-Day Rank
#192
Mission: SPACE Orange
Average Posted Wait
49
7-Day Rank
#1
30-Day Rank
#1
365-Day Rank
#31
Soarin’
Average Posted Wait
65
Actual Waits Were
63%
7-Day Rank
#1
30-Day Rank
#1
365-Day Rank
#25
Spaceship Earth
Average Posted Wait
21
Actual Waits Were
72%
7-Day Rank
#4
30-Day Rank
#10
365-Day Rank
#120
Test Track
Average Posted Wait
96
Actual Waits Were
57%
7-Day Rank
#1
30-Day Rank
#1
365-Day Rank
#14
The Seas with Nemo & Friends
Average Posted Wait
14
7-Day Rank
#3
30-Day Rank
#7
365-Day Rank
#125
Frozen Ever After
Average Posted Wait
97
7-Day Rank
#1
30-Day Rank
#1
365-Day Rank
#5

The post Crowds Ahoy! Walt Disney World Wait Times for Wednesday, November 25, 2020 appeared first on TouringPlans.com Blog.

From our friends at touringplans.com

Filed Under: Walt Disney World (FL), wait times